
Report week: 17–23 August 2026 · Audience: women’s fashion only
This report is calculated from a fully reconciled, single-gender slice of the TrendQ corpus. Women’s tops and outerwear gained share versus the preceding seven complete weeks, while shoes and dresses eased. Every change below is expressed in percentage points, not growth.
Executive merchant read: Promote top-led outfitting and test additional outerwear depth; keep shoe and dress receipts disciplined while using color-led bundles to protect conversion. Treat corpus imagery as qualitative merchandising context, not as the statistical sample.
Signal table
| Category | Current vs seven-week baseline |
|---|---|
| Tops | 70.4% (383/544) vs 64.6% (2,967/4,591); +5.78 pp · Qualified, 200 creators, q=0.038 |
| Shoes | 36.4% (198/544) vs 42.1% (1,932/4,591); −5.69 pp · Qualified, 128 creators, q=0.038 |
| Outerwear | 19.5% (106/544) vs 15.5% (712/4,591); +3.98 pp · Qualified, 85 creators, q=0.039 |
| Dresses | 21.9% (119/544) vs 25.8% (1,186/4,591); −3.96 pp · Qualified, 95 creators, q=0.079 |
| Bags | 37.7% (205/544) vs 40.9% (1,877/4,591); −3.20 pp · Not qualified, q=0.211 |
| Bottoms | 56.4% (307/544) vs 53.9% (2,475/4,591); +2.52 pp · Below effect floor |
| Accessories | 89.2% (485/544) vs 87.6% (4,023/4,591); +1.53 pp · Below effect floor |
Baseline: the seven complete weeks from 29 June–16 August 2026. Shares use deduplicated outfits as the denominator. A qualified movement requires an absolute change of at least 3 pp, sufficient counts, at least 20 current creators, and Benjamini–Hochberg FDR q≤0.10.
Category and color breakdown
The week contains 1,803 category observations across 544 deduplicated outfits. Of those, 1,582 category observations carry at least one usable color label. Color percentages below are current-week, within-category multi-label shares; they are not week-over-week claims.
| Category | Leading current colors | Color-labelled observations |
|---|---|---|
| Tops | White 39.8%; black 22.3%; blue 9.7% | 382 |
| Bottoms | Black 24.8%; white 24.1%; blue 19.2% | 307 |
| Shoes | Black 34.3%; white 22.7%; brown 15.7% | 198 |
| Outerwear | Black 19.8%; beige 13.2%; blue 12.3% | 106 |
| Dresses | White 29.8%; black 20.2%; blue 16.7% | 114 |
| Bags | Black 25.4%; brown 23.4%; beige 18.0% | 205 |
| Accessories | Black 49.6%; brown 26.7%; white 15.9% | 270 |
1. Promote white-top outfitting
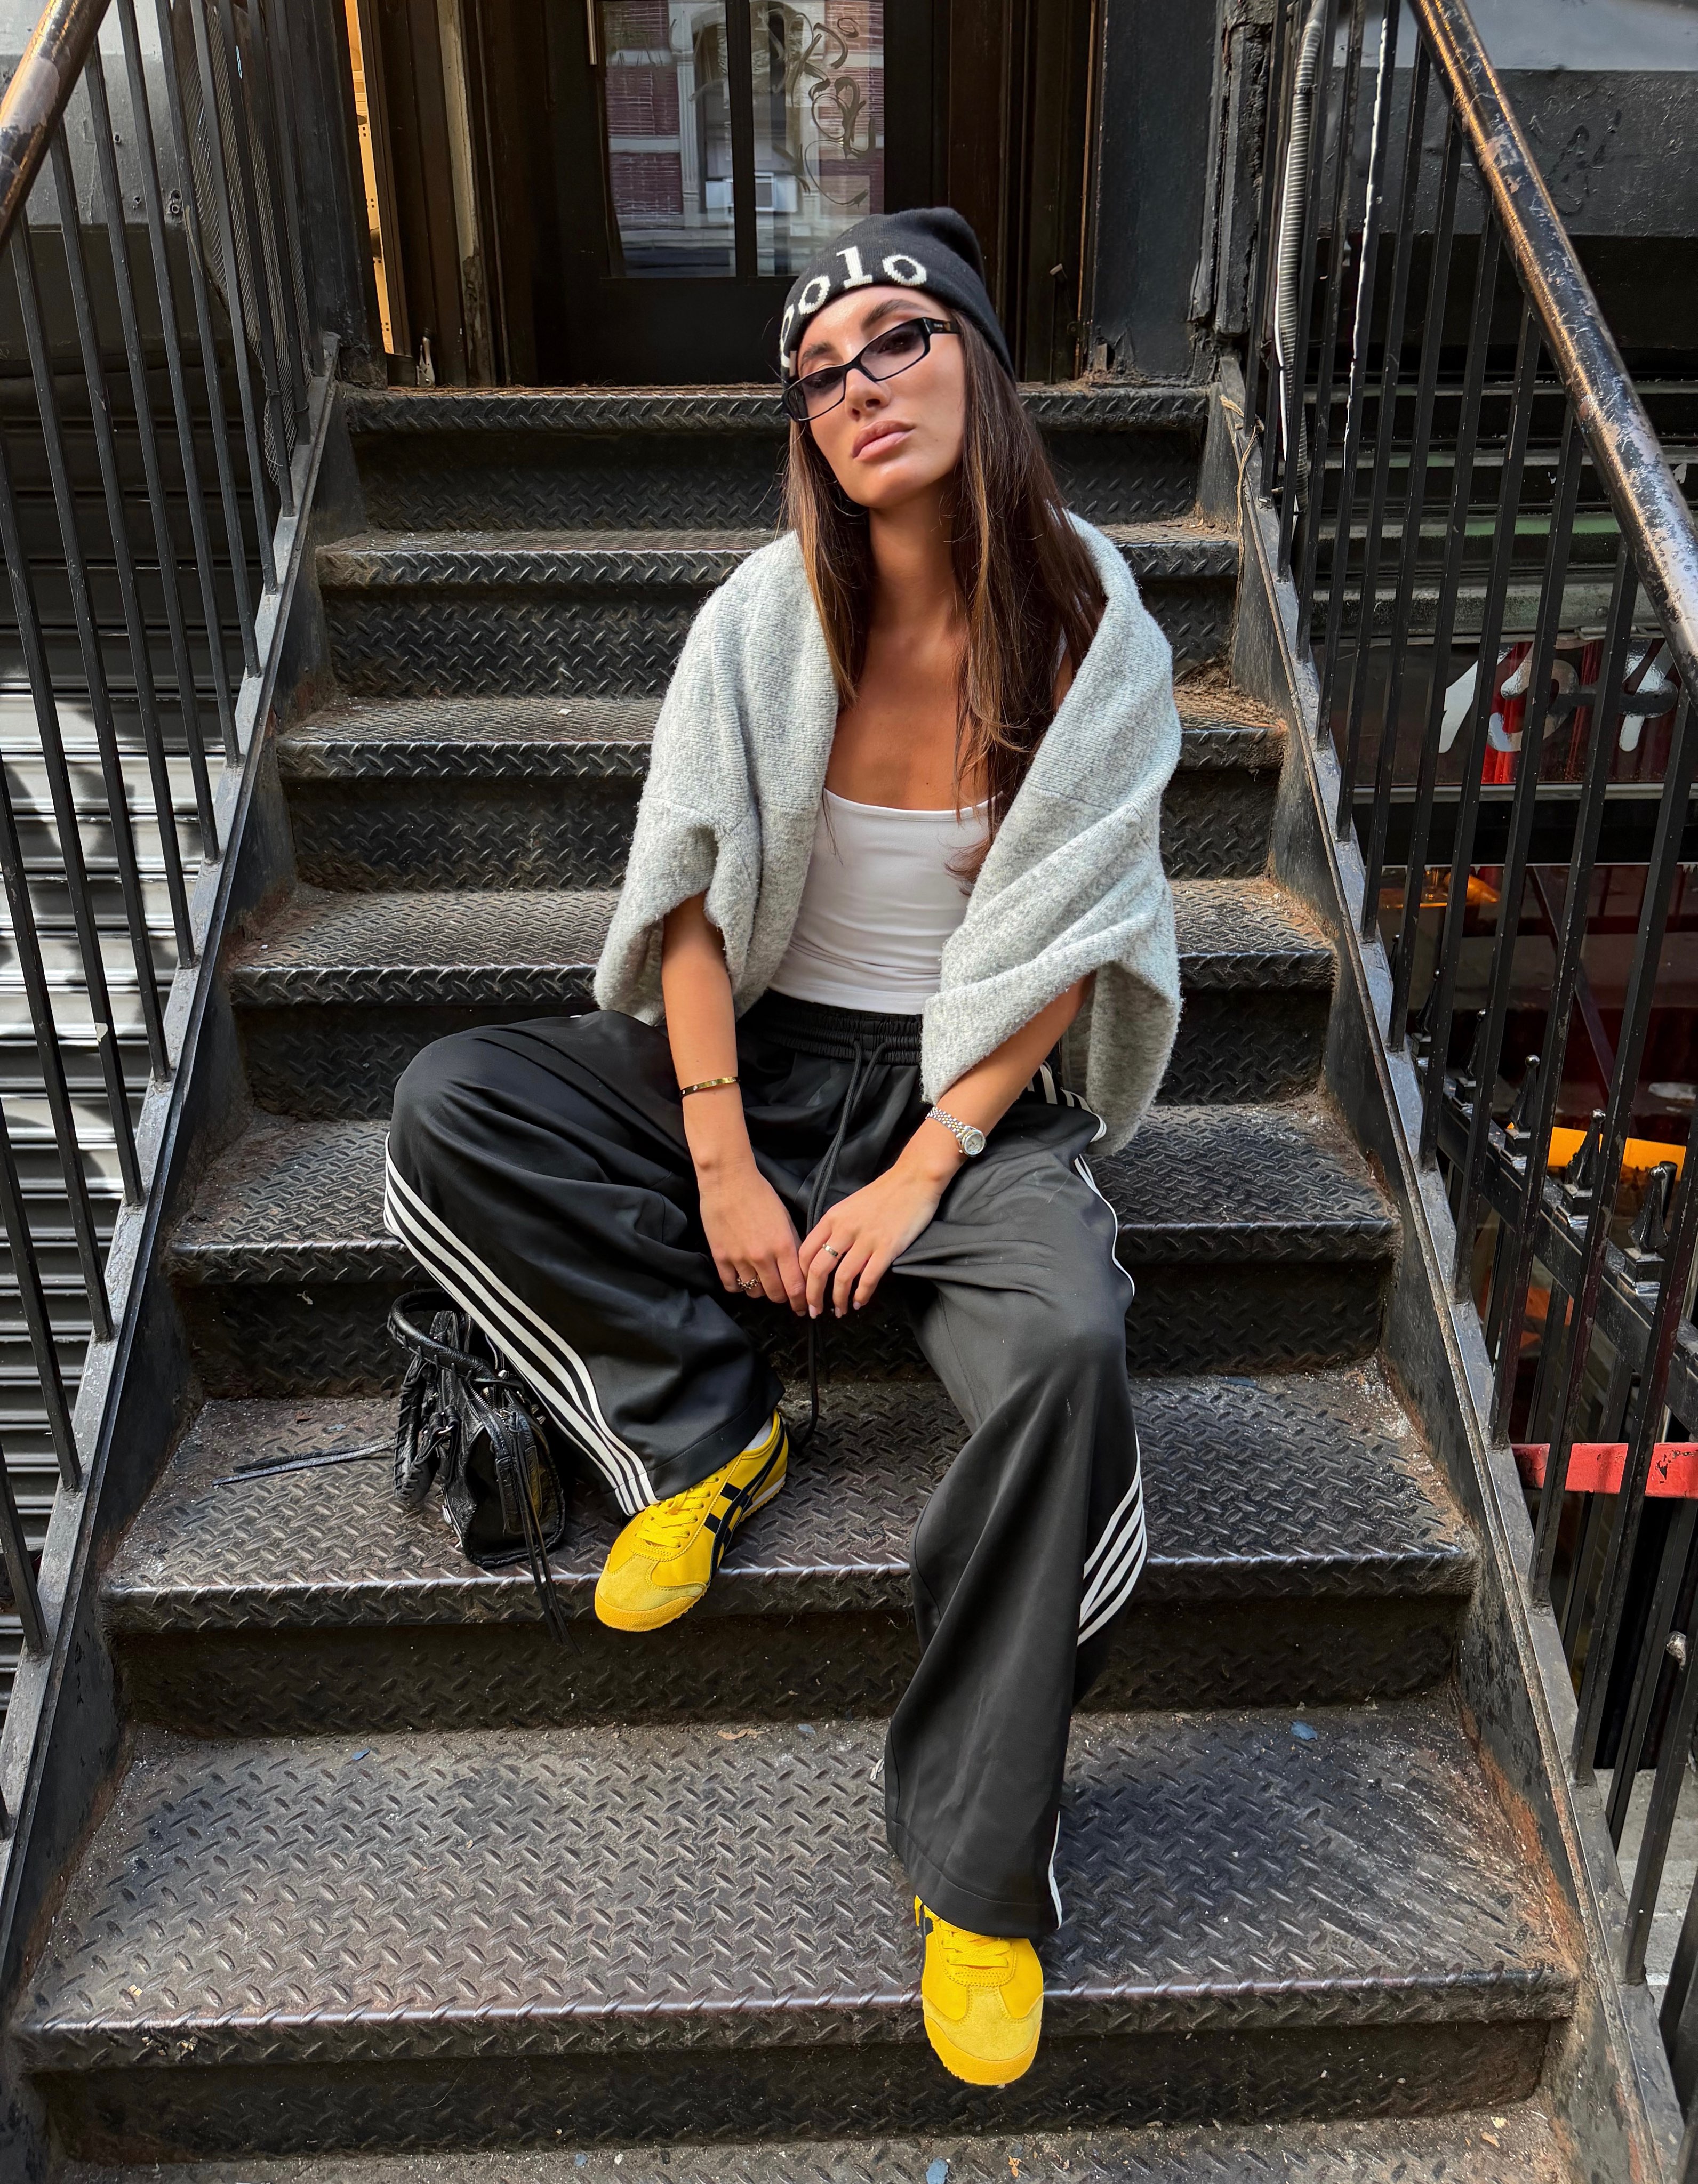
Tops reached 70.4% of women’s outfits, +5.78 pp versus baseline. White is the leading labelled top color at 39.8%.
Promote: Lead with white-top modules across fitted, relaxed, and layered silhouettes. Pair them with black, white, and blue bottoms so the largest current color/category block converts into complete looks.
2. Bundle black footwear, but keep receipts measured
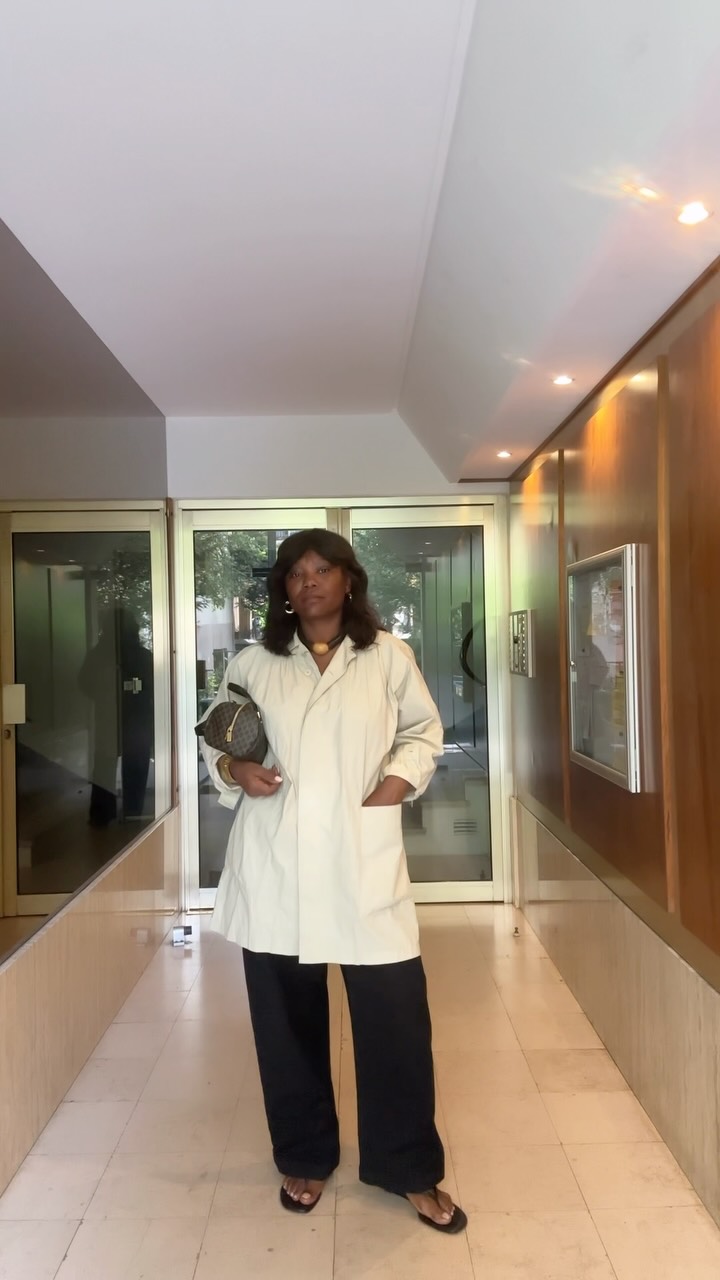
Shoe presence was 36.4%, −5.69 pp versus baseline, although black remains the leading current shoe color at 34.3%.
Bundle: Attach black sandals and low-profile shoes to white-top and dress stories. Avoid treating the strong black mix within shoes as evidence that the overall shoe category increased.
3. Test outerwear depth around black layers
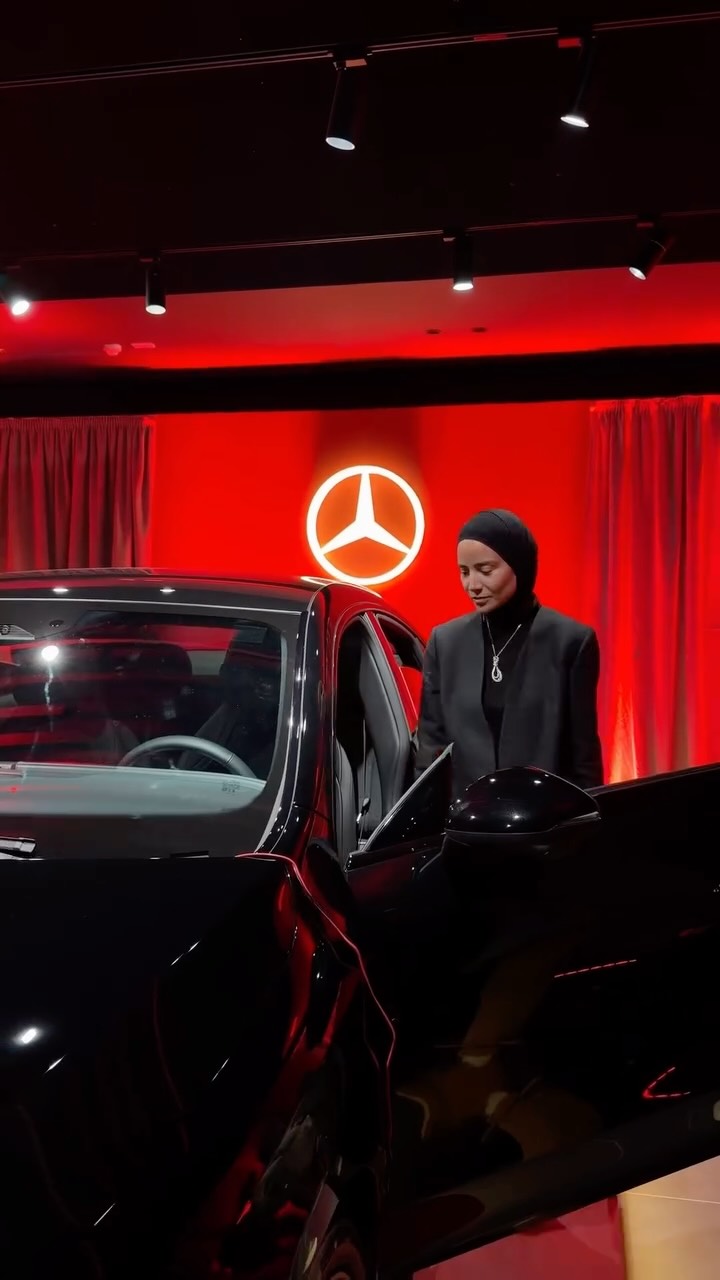
Outerwear appeared in 19.5% of women’s outfits, +3.98 pp versus baseline. Black leads its current labelled palette at 19.8%, followed by beige and blue.
Test and restock: Add measured depth to black blazers and light layers, then validate demand with click-through, conversion, sell-through, stock, and returns before broadening buys.
4. Watch dress depth; merchandise white selectively
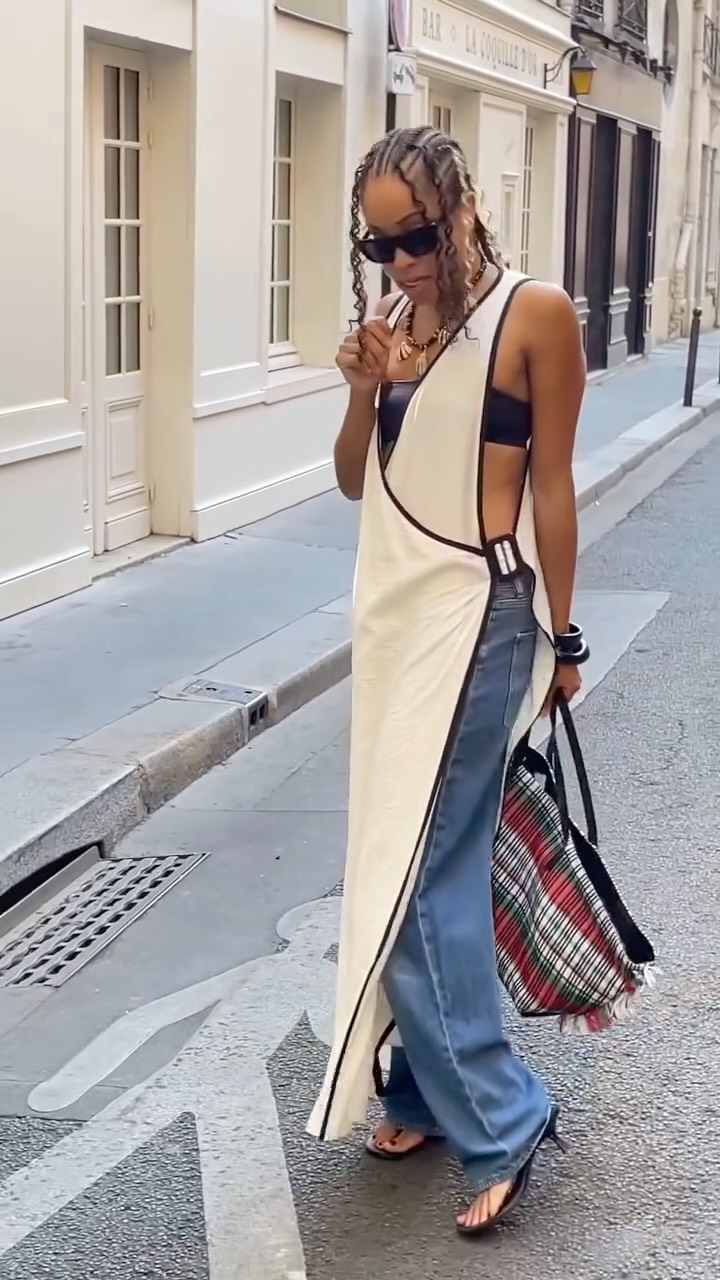
Dresses represented 21.9% of outfits, −3.96 pp versus baseline. White leads the current color-labelled dress mix at 29.8%.
Watch: Keep dress depth controlled and use white dresses as a focused visual story, not a reason to expand the whole category without supporting store demand.
Merchant action board
- Promote: white tops across high-traffic category and outfit pages.
- Bundle: black shoes with top-led and dress-led complete looks.
- Restock: proven black lightweight outerwear selectively.
- Test: beige and blue outerwear in shallow depth.
- Watch: shoe and dress sell-through before adding receipts.
Methodology and confidence
Exact audience: women-labelled creator profiles only; unknown and other gender labels are excluded. Period: Monday 17 August through Sunday 23 August 2026. The full week reconciled at 838 eligible reference posts and 838 distinct flat-slice posts, with no missing IDs. The women’s audience reconciled at 621 canonical eligible posts and 621 flat-slice posts.
After statistical eligibility, canonical outfit deduplication, and a maximum of four distinct outfits per creator per week, the analytical slice contains 552 posts, 544 deduplicated outfits, 233 distinct creators, 1,803 category observations, and 1,582 color-labelled category observations. The seven-week baseline is 29 June–16 August 2026 and contains 4,591 women’s outfits.
Category-share movements use two-proportion tests with Benjamini–Hochberg false-discovery control at q≤0.10, a 3 pp effect floor, minimum observation counts, and a 20-creator current-week breadth rule. The corpus refresh and fashion extraction completed after the report period on 24 August 2026 at 21:16 UTC.
All four images are current-week women’s corpus examples from distinct creators. Each image and credit links to the owner’s exact original post. Images illustrate nearby claims qualitatively; they are not the statistical sample and do not establish sales demand. This is creator-content intelligence, not a sales forecast.