
Report week: 24–30 August 2026 · Audience: men’s fashion only
This report is calculated from a fully reconciled, single-gender slice of the TrendQ corpus. No men’s category movement cleared the statistical qualification and creator-breadth gates this week. The report therefore treats category and color patterns as current composition—not rising, fading, or growth claims. Every difference below is expressed in percentage points.
Executive merchant read: Keep men’s buys anchored to the established top–bottom formula, then use black shoes and navy outerwear as testable connectors. Maintain restraint: the sample is healthy enough for a normal report, but none of the week-over-baseline differences qualifies as movement.
Signal table
| Category | Current vs seven-week baseline |
|---|---|
| Tops | 86.7% (209/241) vs 88.4% (1,260/1,425); −1.70 pp · Not qualified, q=0.908 |
| Bottoms | 78.8% (190/241) vs 75.9% (1,081/1,425); +2.98 pp · Below 3 pp effect floor |
| Accessories | 77.6% (187/241) vs 82.2% (1,172/1,425); −4.65 pp · Not qualified, q=0.831 |
| Shoes | 45.6% (110/241) vs 47.2% (673/1,425); −1.58 pp · Below effect floor |
| Outerwear | 32.8% (79/241) vs 31.8% (453/1,425); +0.99 pp · Stable |
| Bags | 8.7% (21/241) vs 11.0% (157/1,425); −2.30 pp · 15 current creators; below breadth rule |
| Dresses | 0.4% (1/241) vs 0.4% (6/1,425); −0.01 pp · 1 current creator; not actionable |
Baseline: the seven complete weeks from 6 July–23 August 2026. Shares use deduplicated outfits as the denominator. A qualified movement requires an absolute change of at least 3 pp, sufficient counts, at least 20 current creators, and Benjamini–Hochberg FDR q≤0.10. No category qualifies this week.
Category and color breakdown
The week contains 797 category observations across 241 deduplicated outfits. Of those, 762 category observations carry at least one usable color label. Color percentages below are current-week, within-category multi-label shares; they are descriptive composition only.
| Category | Leading current colors and labelled count |
|---|---|
| Tops | White 41.1%; black 18.2%; blue 13.4% · n=209 |
| Bottoms | Black 25.4%; dark gray 11.6%; white 11.6% · n=189 |
| Shoes | Black 45.5%; white 35.5%; brown 20.0% · n=110 |
| Outerwear | Black 20.3%; navy 20.3%; blue 11.4% · n=79 |
| Bags | Black 47.6%; brown 14.3%; navy 14.3% · n=21 |
| Accessories | Black 57.1%; brown 22.7%; white 15.6% · n=154 |
| Dresses | No usable color-labelled observation · n=0 |
1. Promote white tops as a stable anchor
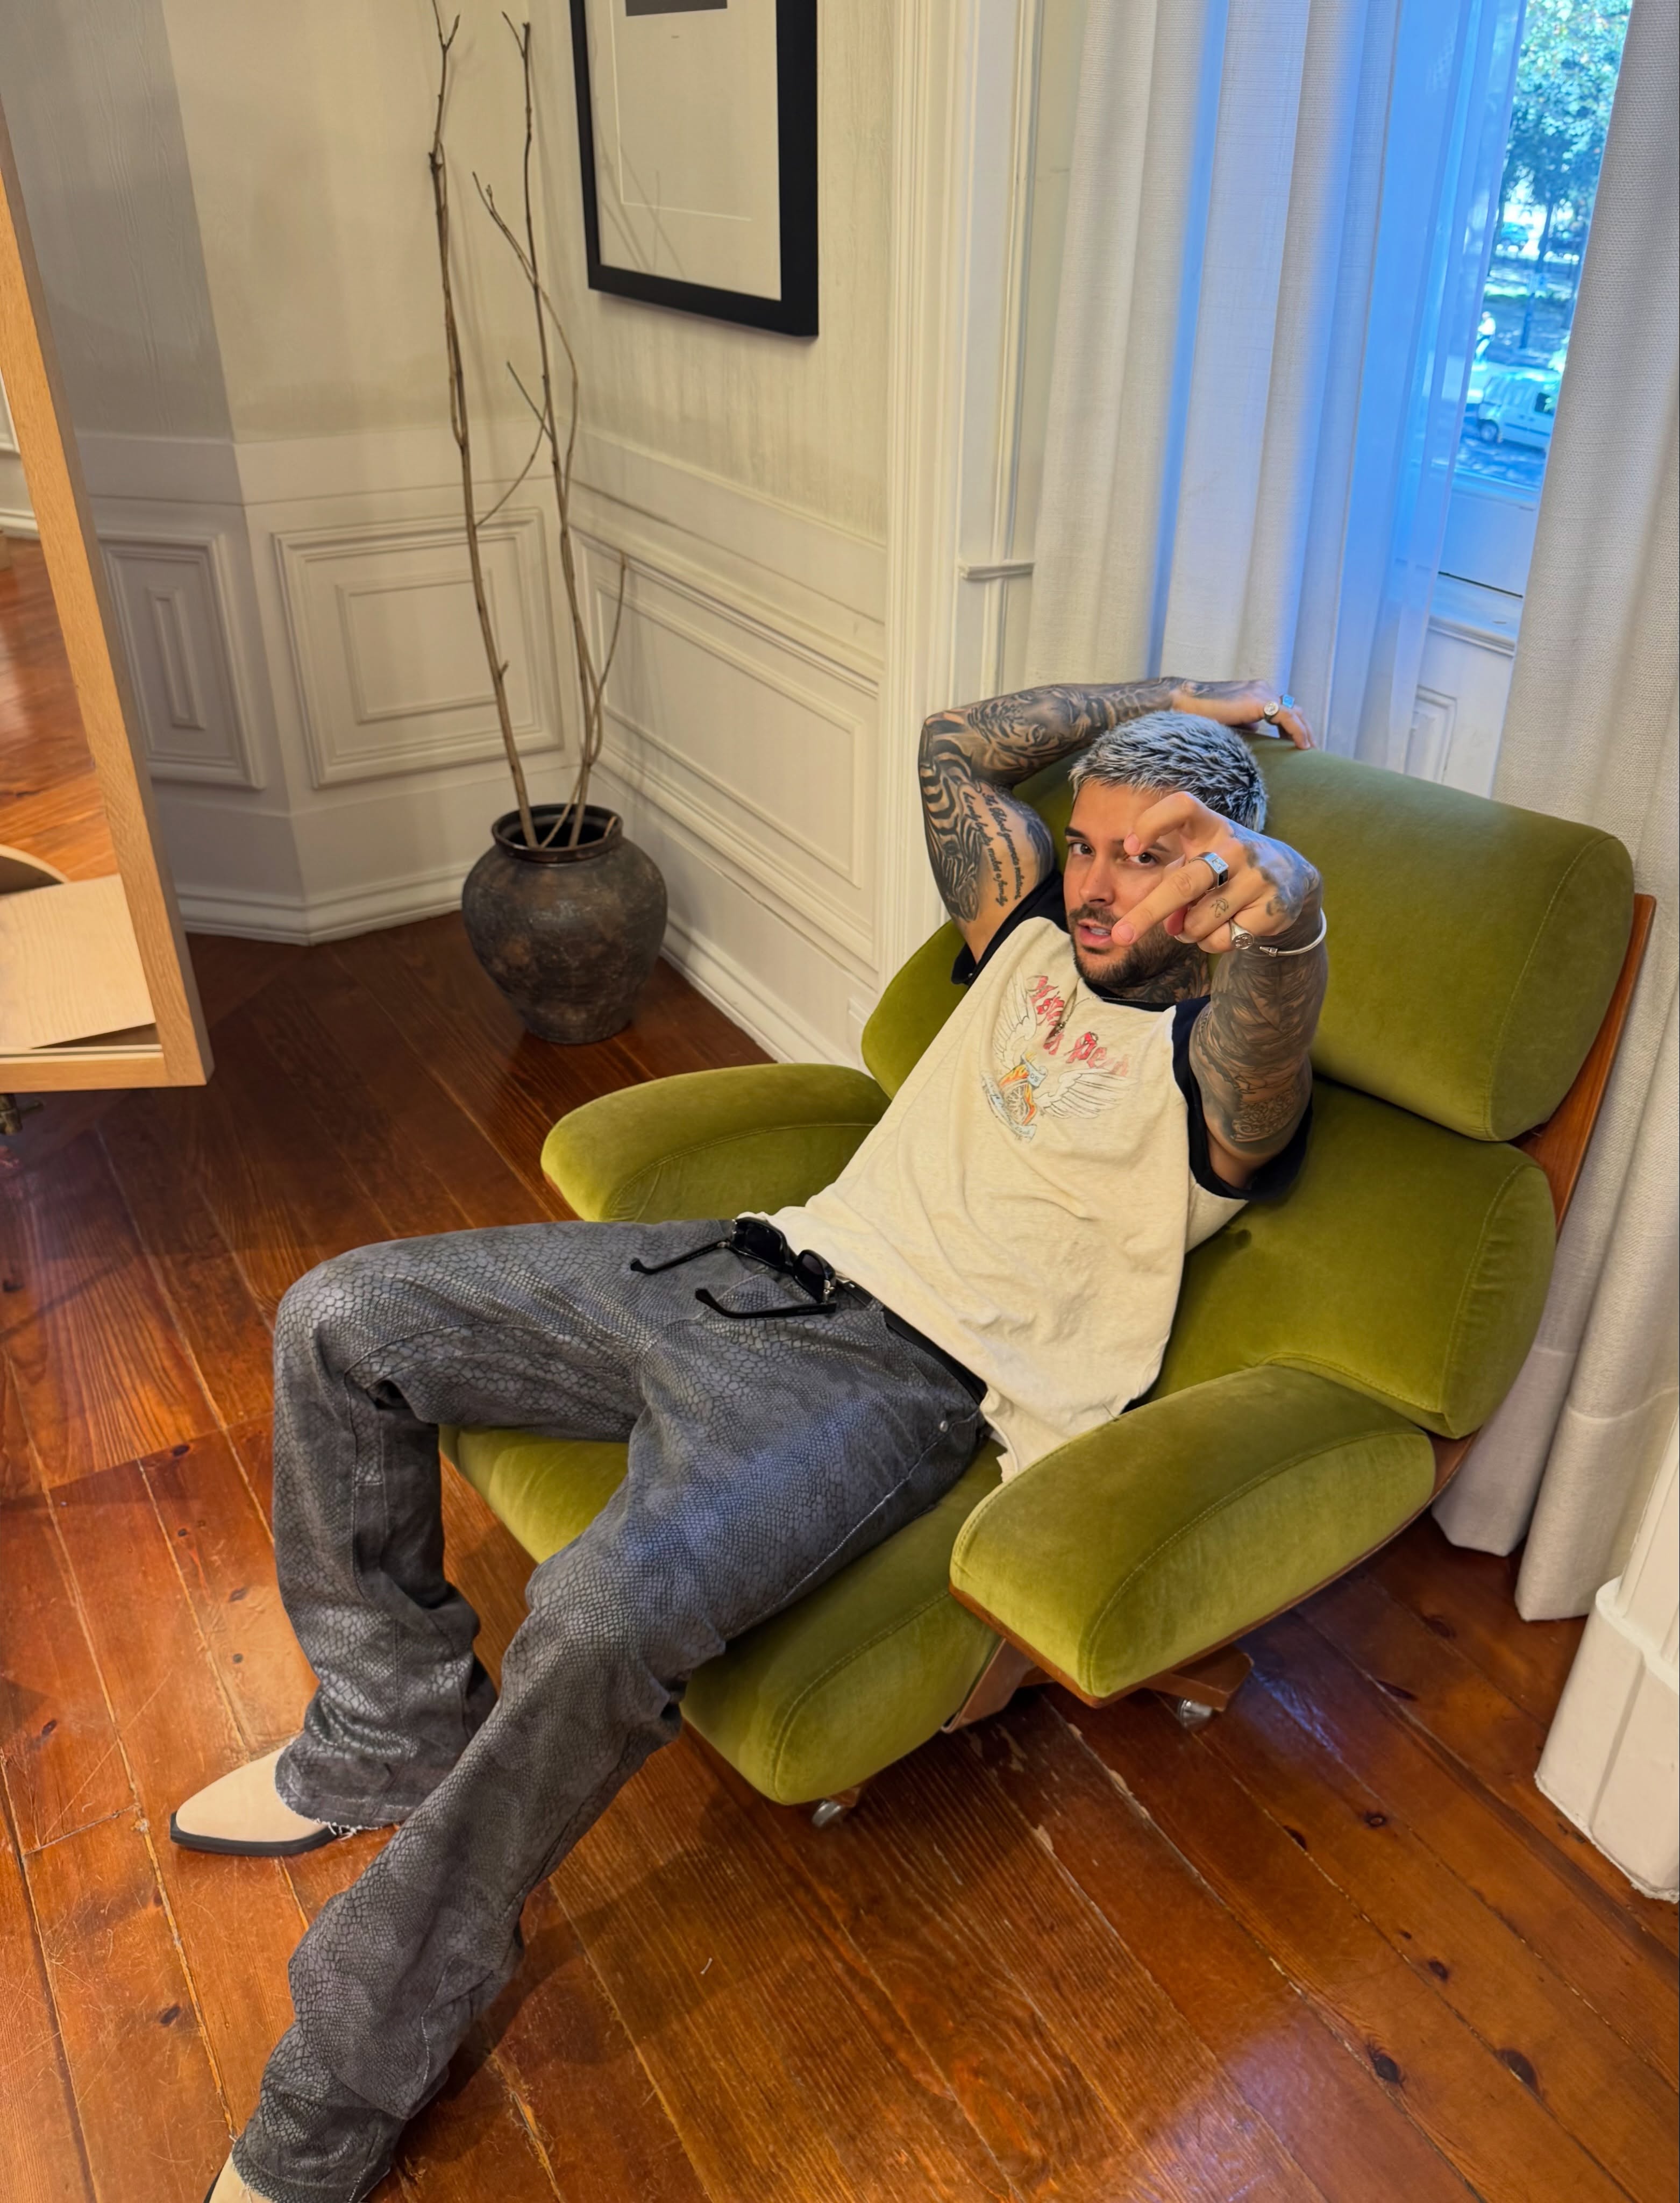
Tops appear in 86.7% of men’s outfits; white leads labelled top observations at 41.1%. Neither measure is a qualified movement.
Promote: Keep white tees, shirts, and lightweight knits visible as reliable outfit starters, then measure store conversion before deepening stock.
2. Bundle black bottoms into the core formula
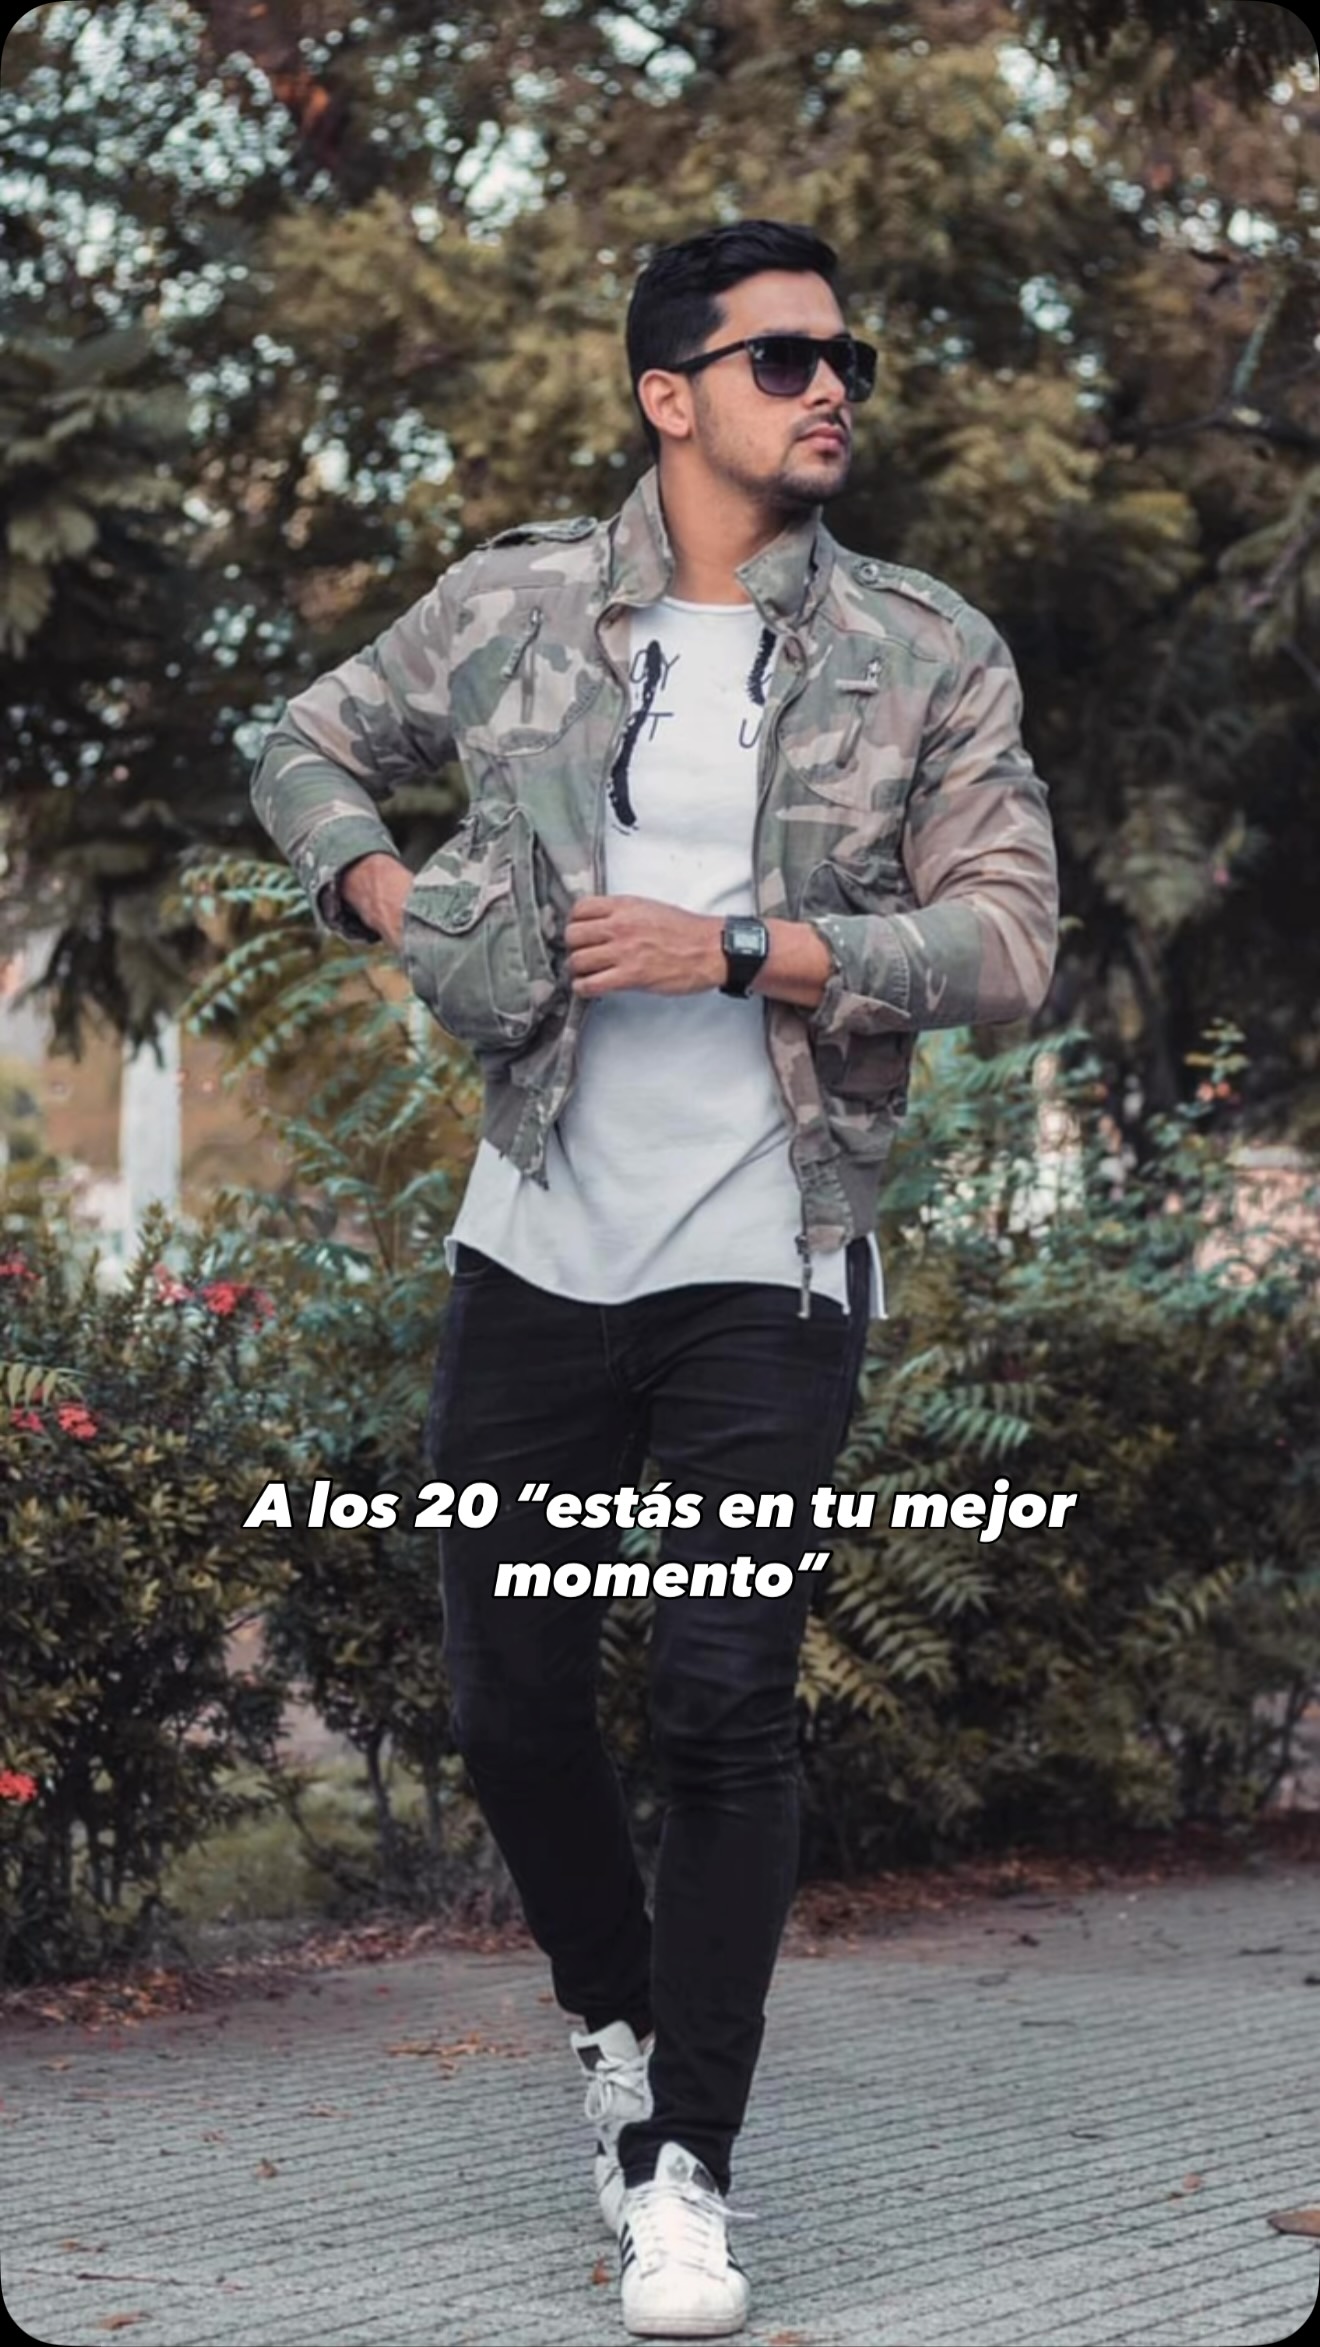
Bottoms represent 78.8% of outfits. Their +2.98 pp difference is just below the 3 pp effect floor; black is the largest labelled bottom color at 25.4%.
Bundle: Pair black trousers and relaxed bottoms with white tops. Treat the pairing as current composition, not proof of acceleration.
3. Attach black shoes across looks
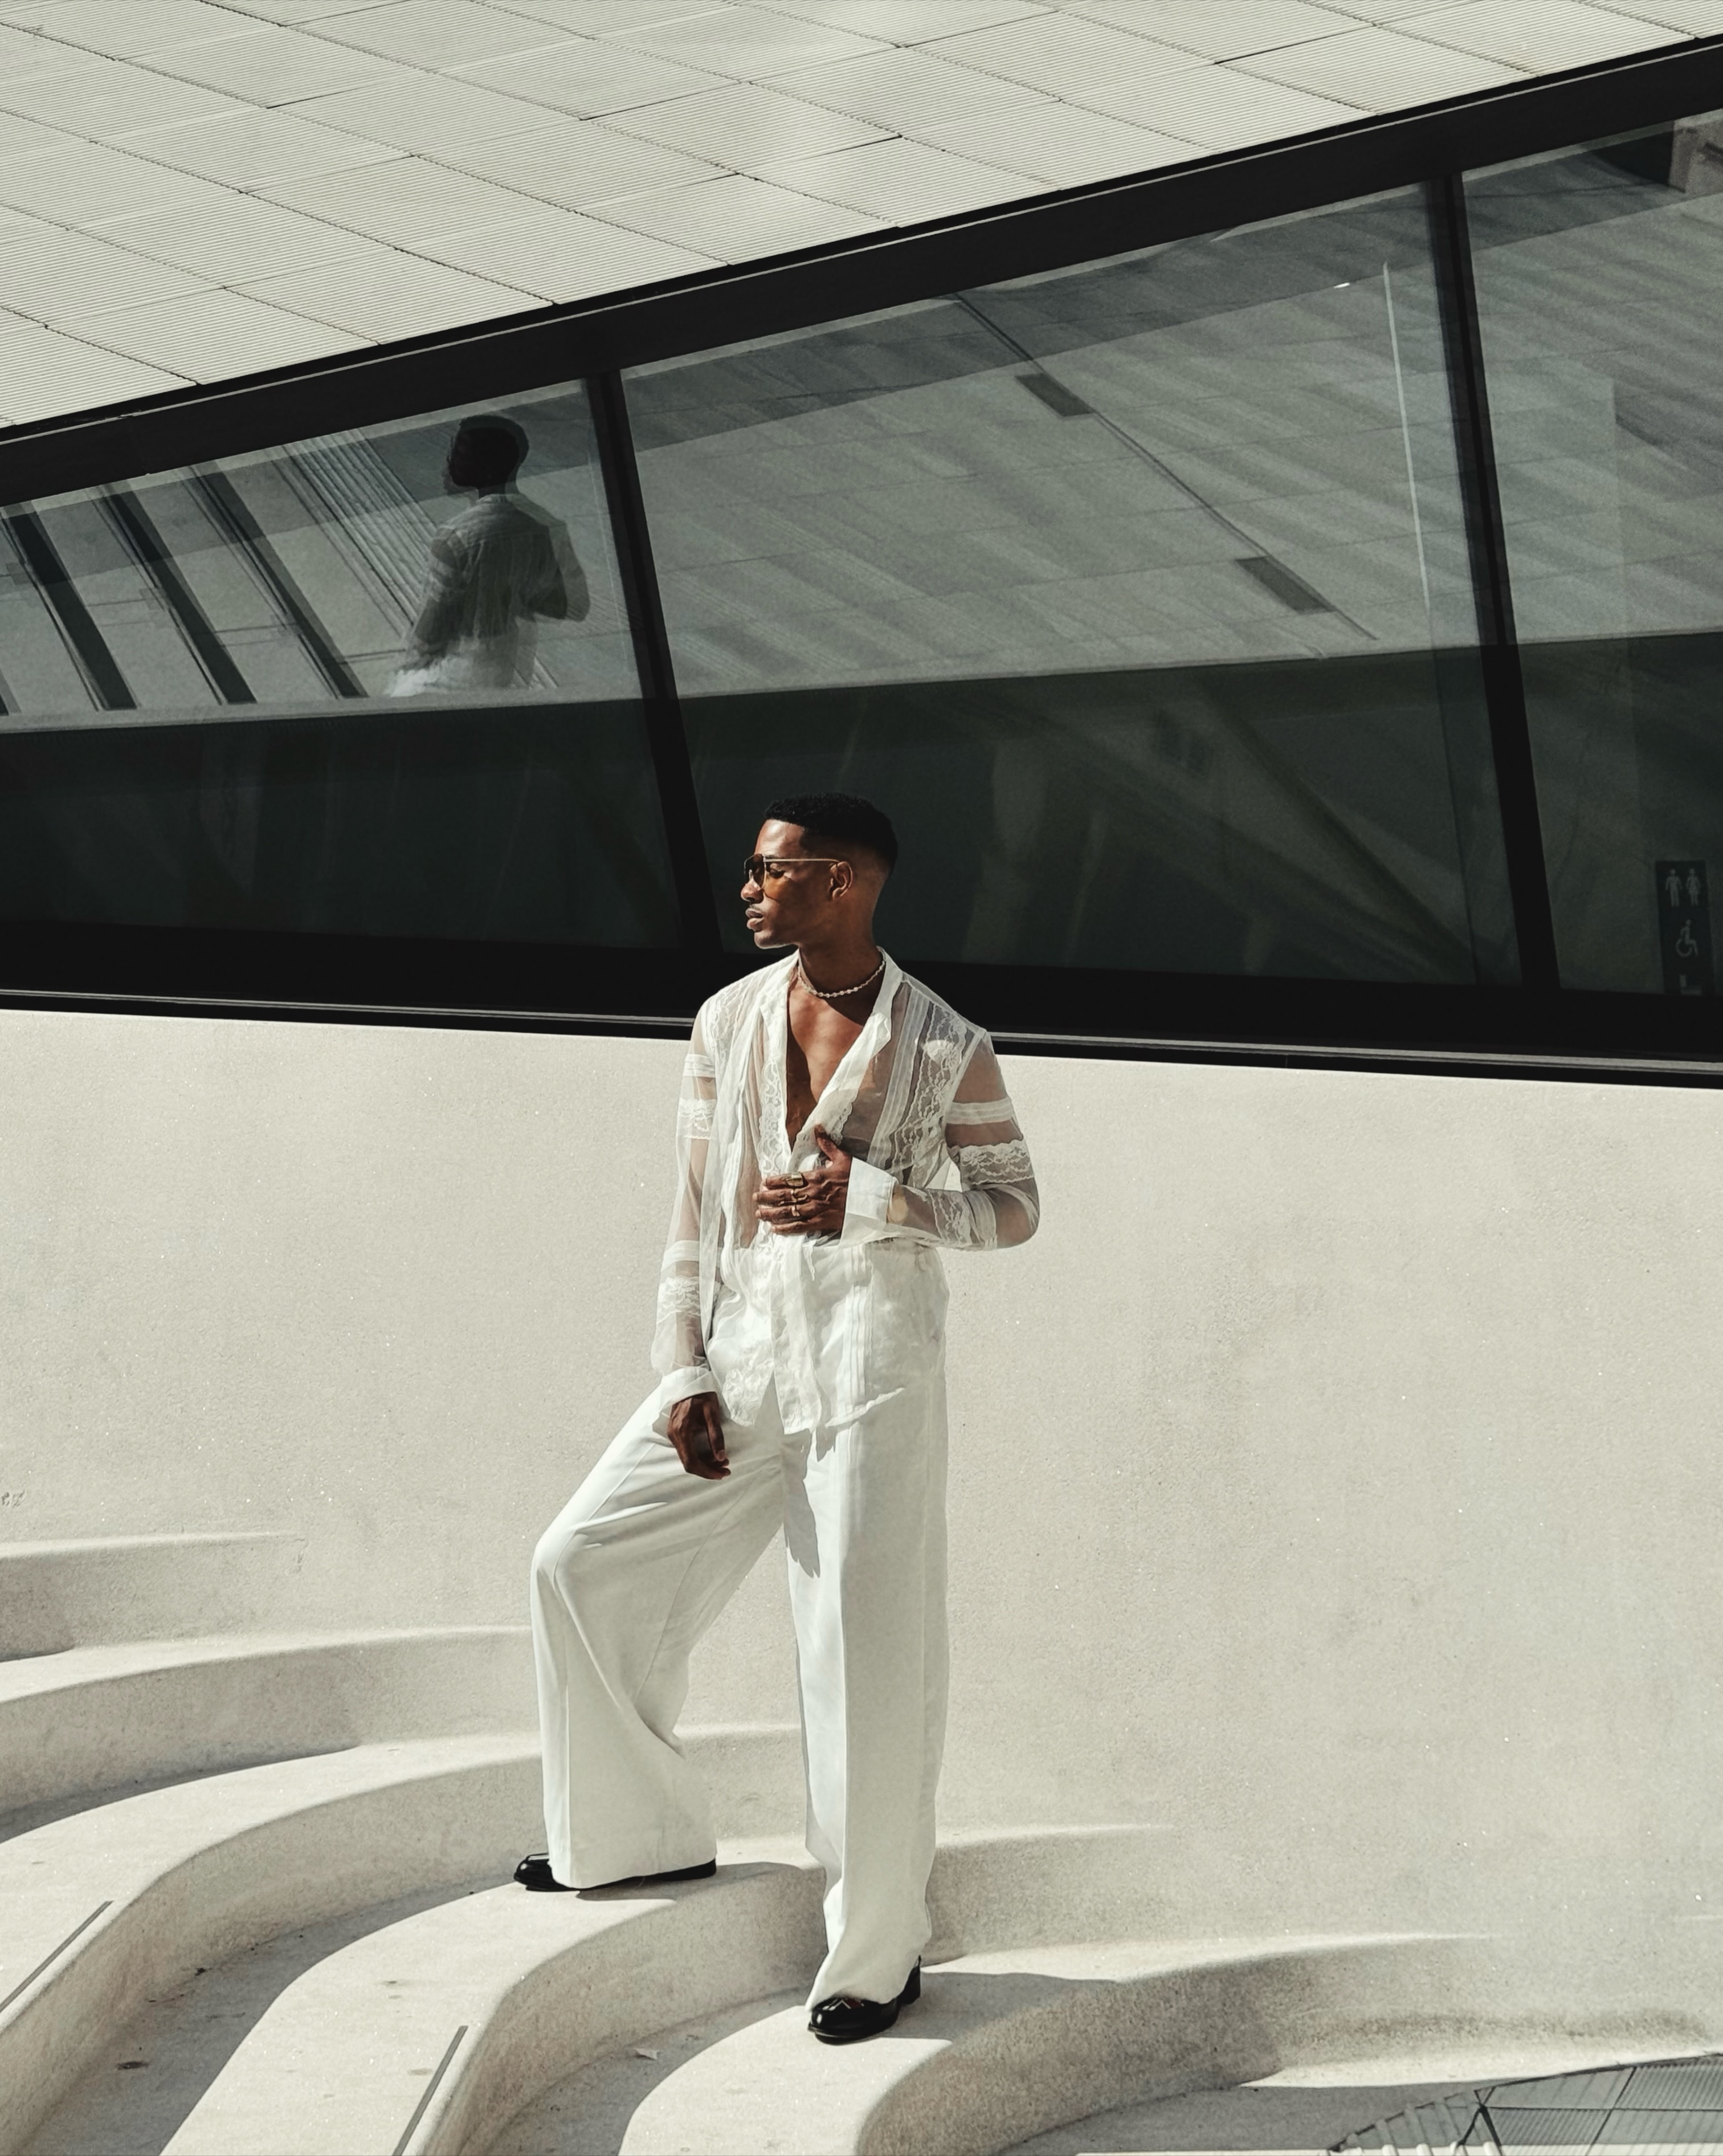
Shoes appear in 45.6% of outfits, with black leading the labelled shoe palette at 45.5%.
Attach: Use black loafers and clean-profile shoes across white-top and black-bottom bundles. Keep the action cross-selling-led rather than receipt-led.
4. Test navy outerwear beside black
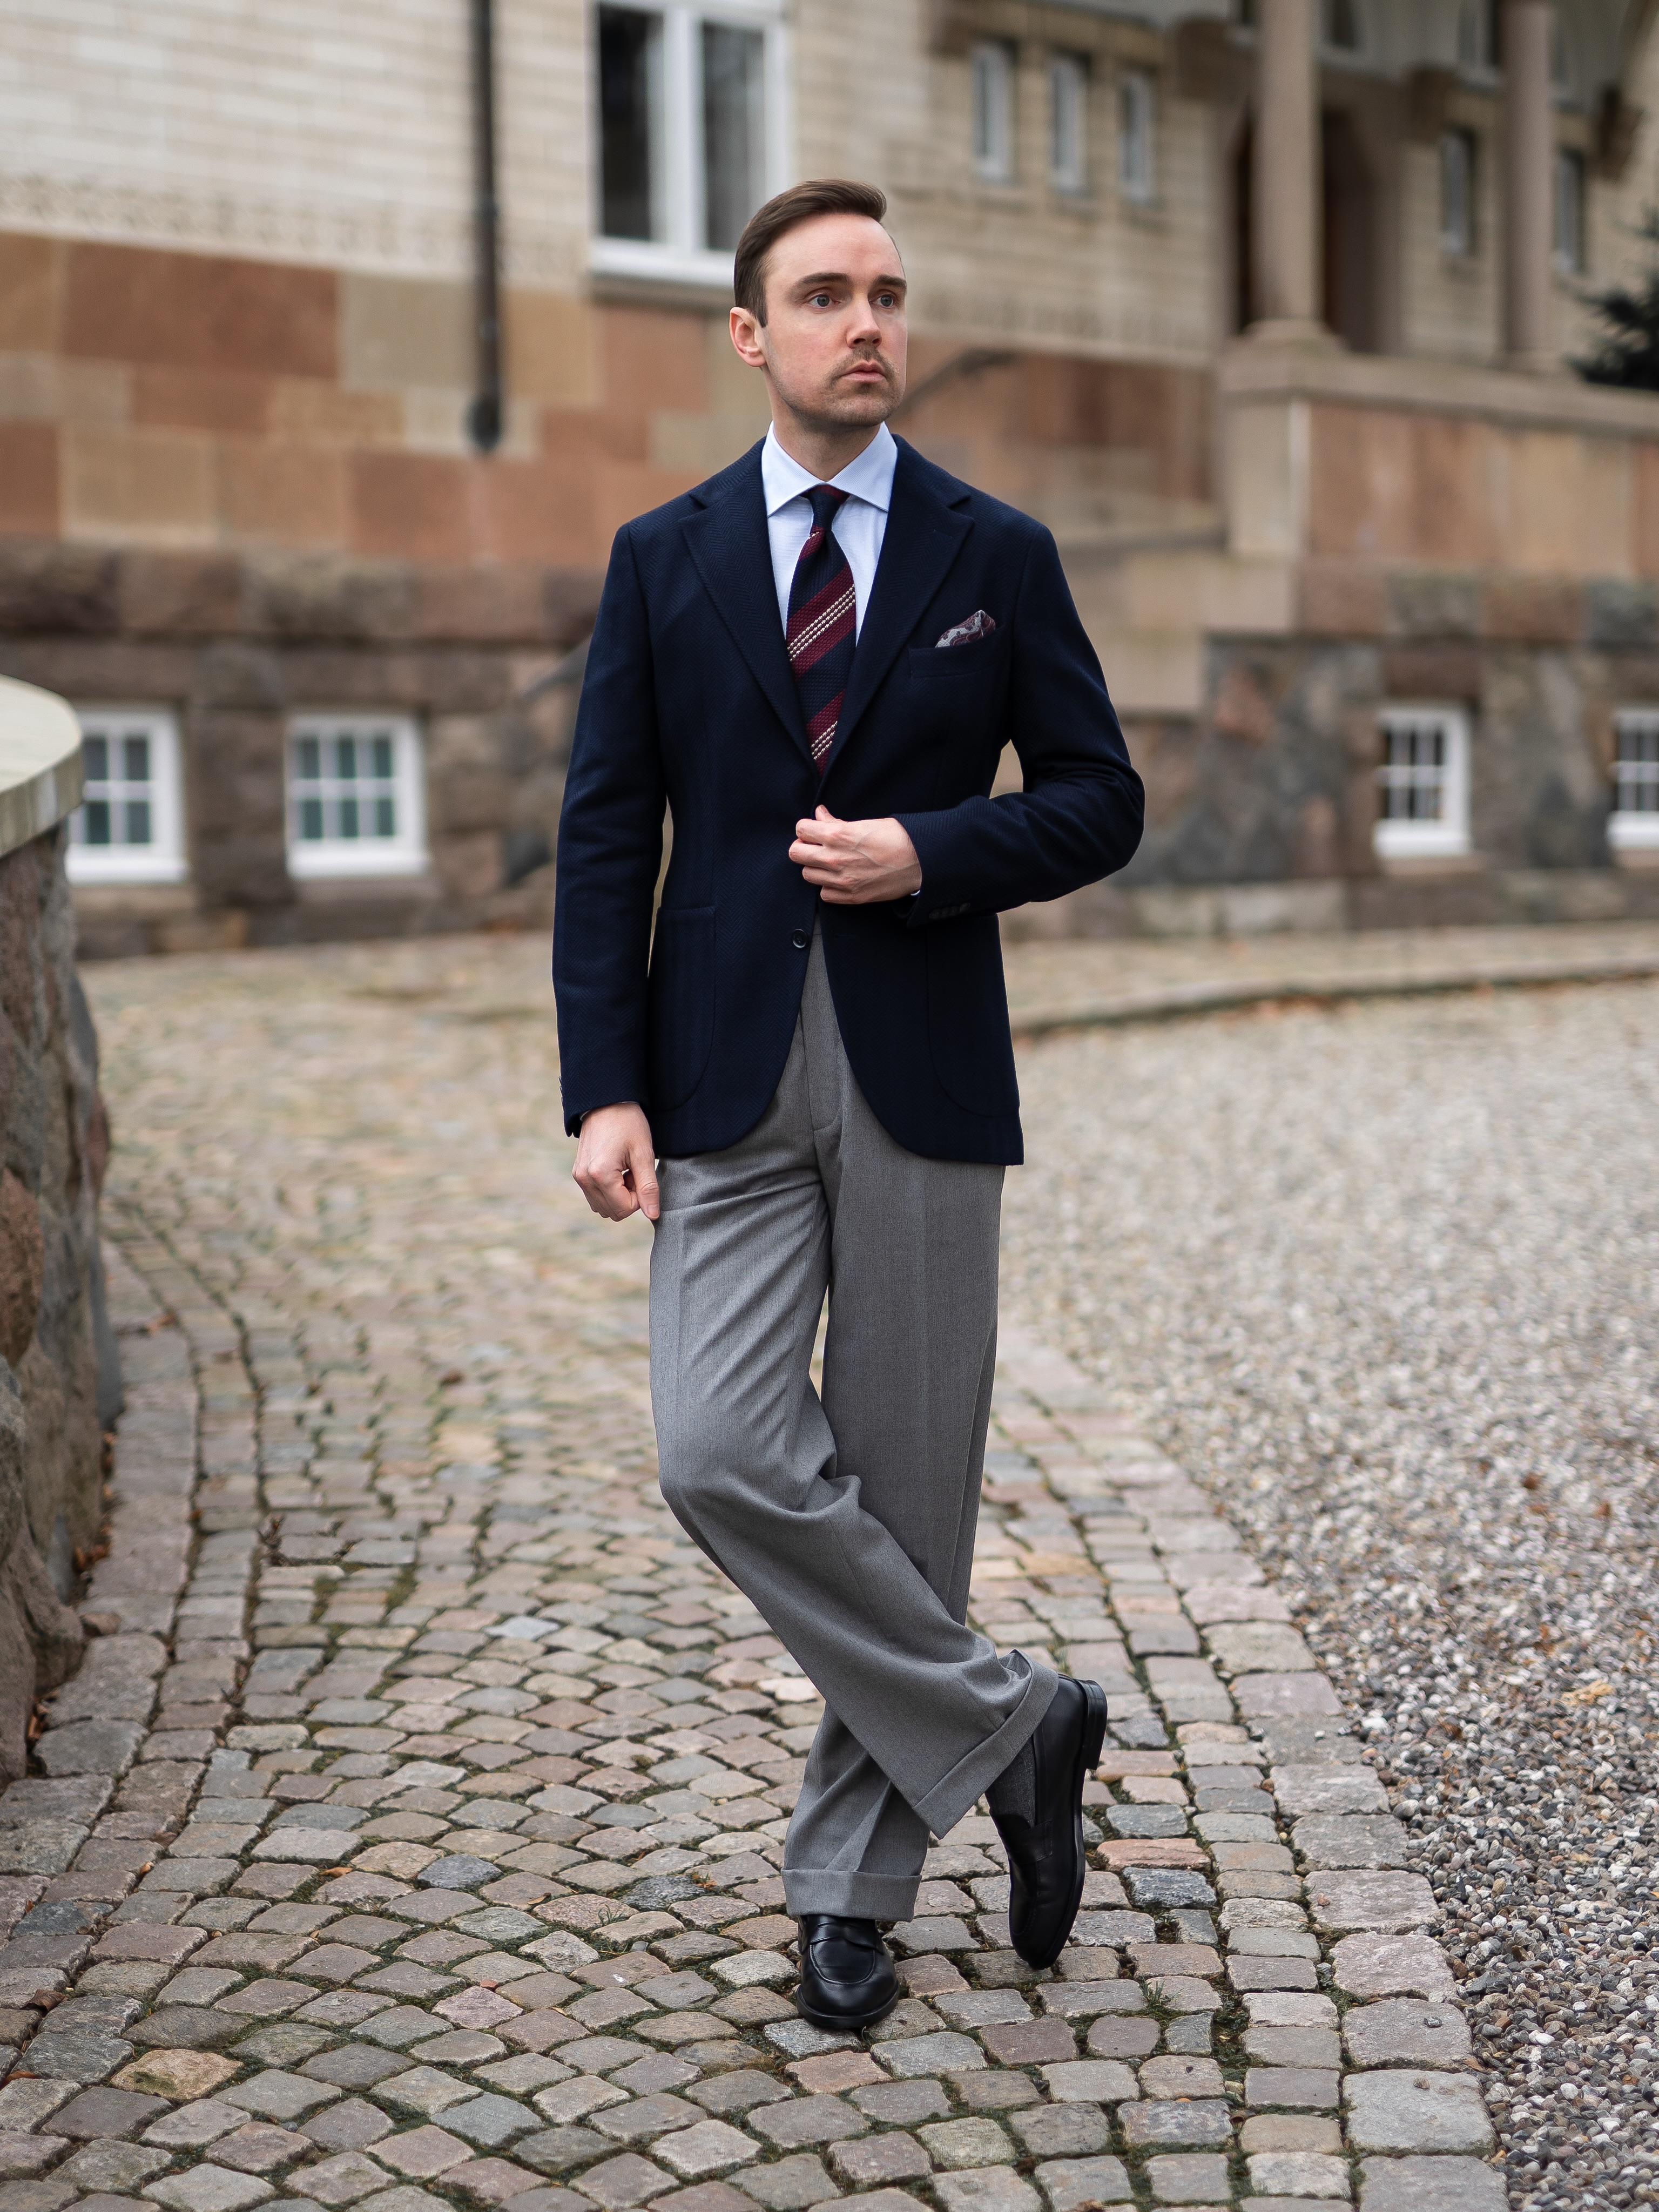
Outerwear is stable at 32.8% of outfits. Black and navy share the labelled color lead at 20.3% each.
Test and watch: Run black and navy outerwear side by side in shallow depth, then let click-through, conversion, sell-through, and returns decide the winner.
Merchant action board
- Promote: white tops as the first layer in men’s outfit modules.
- Bundle: black bottoms and black shoes into complete-look offers.
- Restock: only proven core white tops and black shoes based on store demand.
- Test: navy versus black outerwear in equal, shallow depth.
- Watch: accessories and bags; neither has evidence for directional buying this week.
Methodology and confidence
Exact audience: men-labelled eligible looks only; female, unknown, and other gender labels are excluded. Period: Monday 24 August through Sunday 30 August 2026. The full week reconciled at 1,458 eligible reference posts and 1,458 distinct flat-slice posts, with no missing or extra IDs. The men’s audience reconciled at 244 canonical eligible posts and 244 flat-slice posts.
After statistical eligibility, source controls, canonical outfit deduplication, and a maximum of four distinct outfits per creator per week, the analytical slice contains 197 posts, 241 deduplicated outfits, 104 distinct creators, 797 category observations, and 762 color-labelled category observations. The seven-week baseline is 6 July–23 August 2026 and contains 1,425 men’s outfits.
Category-share movements use cluster-aware two-proportion tests with Benjamini–Hochberg false-discovery control at q≤0.10, a 3 pp effect floor, minimum observation counts, and a 20-creator current-week breadth rule. No category clears every gate. The completed-week corpus refresh and associated fashion extraction finished after the report period; the slice refresh timestamp is 31 August 2026 at 21:00:56 UTC.
All four images are current-week men’s corpus examples from distinct creators. Each image and credit links to the owner’s exact original post. Images illustrate nearby claims qualitatively; they are not the statistical sample and do not establish sales demand. This is creator-content intelligence, not a sales forecast.